Put the question on the bench first
Performance Factory is a cricket reading workshop. We take familiar numbers apart, inspect the assumptions underneath them and put them back into a match situation. The purpose is practical: a reader should be able to explain what a figure measures, where its inputs came from and what it leaves unresolved. A confident verdict is easy to publish. A claim that somebody else can check is more useful. Start with the question you are trying to answer, then decide whether the available evidence can answer it.
The workshop has two longer manuals. One explains fair player comparisons; the other examines what happens when a sample is too small to carry the conclusion attached to it. The examples are our own invented data, not a current leaderboard or a forecast. No registration, account balance or private information is required to read them. Our tools are definitions, arithmetic and explicit boundaries around a claim. You can use the same approach with a scorecard, a spreadsheet or a notebook while watching a match.
Decide what performance means in this situation
Performance can describe a contribution to a particular match, a record across a season or suitability for a role. Those are related questions, but they are not the same question. A player may have a strong long-term record while making a modest contribution to one match. A short innings may answer an immediate team need without establishing a new career trend. If the meaning changes halfway through an argument, the statistics can appear to disagree even though they describe different things accurately.
Write the intended meaning in one sentence before looking for a metric. For example, you might ask which batter scored more quickly in a defined set of innings, or which bowler conceded fewer runs per over during a particular competition. Those questions are narrower than who is better, and that is their strength. They make the required inputs visible. They also reveal when you do not have enough information. A useful answer may be that the comparison cannot yet be made on the terms originally proposed.
Give every statistic a specification
A measurement needs a label, a unit and a scope. In cricket, the scope may include a format, a competition, a date range and a role. Put those details beside the number, not several paragraphs away. Two figures can share a name while referring to different samples. If one covers a complete season and another covers a few selected matches, the comparison needs to say so. The apparent precision of a decimal place does not fix uncertainty about which events were counted.
Think of the label as an agreement with the reader. A statement about a season should cover that season under a stated selection rule. A statement about an opening role should explain how the role was identified. If the source does not provide enough detail, preserve that limitation instead of quietly inventing a definition. This is especially important when reusing a chart from another publisher. Before copying the number into your argument, establish what the original publisher intended it to measure.
Convert cricket notation before calculating
Overs are not ordinary decimal quantities. Under the standard six-ball system, 8.2 means eight completed overs and two additional legal balls. That is fifty legal balls, not eight point two times six. Store the ball count as your working quantity and keep the original notation for display. This avoids a common spreadsheet mistake and makes every subsequent rate easier to check. If a source uses a different unit or competition format, identify it before applying a six-ball assumption.
For an invented example, suppose a side scores seventy runs from those fifty legal balls. The rate is seventy multiplied by six and divided by fifty, which equals 8.40 runs per over. A comparison using 8.2 as a decimal divisor would be working from the wrong duration. Show the ball count and the formula alongside the result. The reader can then distinguish a rounding choice from a conversion error and reproduce the calculation without needing to trust a hidden spreadsheet.
Keep the numerator and denominator together
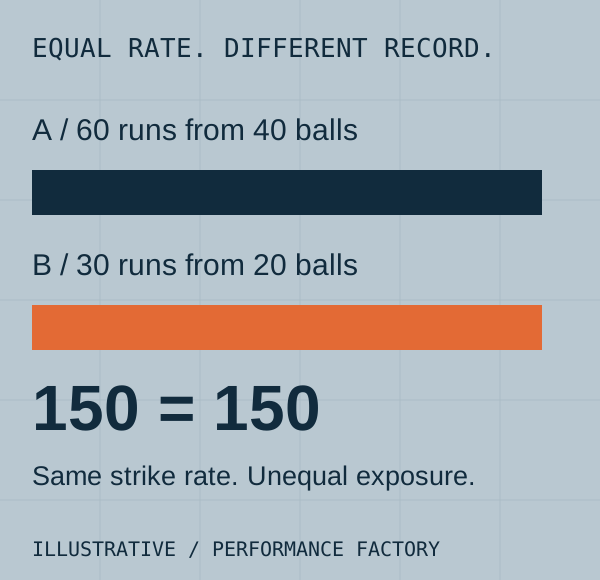
A ratio is a relationship between two quantities. Reporting only the finished ratio can hide the amount of evidence behind it. Consider two invented batting sequences: twelve runs from eight balls and sixty runs from forty balls. Both produce a strike rate of 150 when runs are divided by balls faced and multiplied by one hundred. The shared result does not mean the sequences contain the same amount of information. One describes a much shorter opportunity, and both still need their match setting explained.
Whenever practical, show the underlying quantities with the headline figure. This habit also makes errors easier to locate. If the total runs are correct but the ball count is wrong, you know where to begin the correction. If both inputs are correct but the comparison is misleading, the problem may be the question or the sample selection rather than the arithmetic. Keeping those possibilities separate prevents an argument about cricket from becoming an argument about a calculation nobody has actually inspected.
Compare roles before comparing reputations
Two cricketers can face different tasks even in the same innings. An opener, a middle-order stabiliser and a late hitter may encounter different bowlers, fields and levels of urgency. A rate comparison can still be informative, but it should acknowledge those opportunities. Do not make a role adjustment by inventing an unexplained bonus or penalty. State the difference, narrow the claim and explain which evidence would make the comparison more direct. Sometimes the honest answer is to keep the records side by side without ranking them.
Our comparison manual treats this as a design problem. Specify the task, select relevant observations and check whether the conclusion survives a reasonable change in the sample. If it only works when one particular match is removed, that dependency belongs in the explanation. The point is not to make every possible comparison impossible. It is to keep an understandable boundary around the result. Readers can learn more from a limited claim with clear evidence than from a sweeping verdict whose conditions are invisible.
Recognise what a short sample can do
A small sample can tell you what happened in that sample. It may suggest a question to investigate next. It cannot automatically establish a stable ability, a lasting change in approach or a reliable future outcome. The distinction is easiest to see when you add one new observation. In a short record, one innings or spell can move the summary sharply. That movement is a property of the evidence available, not proof that the player's underlying ability changed by the same amount overnight.
Use a simple sensitivity check. Calculate the figure, add the next eligible observation and calculate it again. Then ask which parts of the written assessment still hold. If the ranking changes but the role analysis does not, keep those conclusions separate. If a single event carries most of the argument, say so. The sample manual shows how to do this without fitting an elaborate model. A transparent arithmetic example is often enough to reveal that a polished chart is making a stronger claim than its inputs support.
Treat match context as evidence, not decoration
Context is most useful when it changes how a claim is defined. A line about conditions added after a conclusion does little if the comparison has already treated incompatible performances as equivalent. Record the innings stage, the available wickets and the objective before deciding which statistic belongs in the analysis. Avoid attaching a stock explanation to a venue name. If you describe a surface or a tactical change, identify the observation or reliable report behind that description.
Format also belongs at the beginning. The ICC's overview of international formats distinguishes Test cricket, one-day internationals and Twenty20 internationals. That broad structure helps explain why time and resources are used differently, but it does not replace the conditions for a specific event. For a decision that turns on a particular rule, consult the applicable ICC playing-conditions documents or the competition's own current regulations. A statistical shortcut cannot settle a rules question.
Separate information from a price or prediction
A scorecard statistic and a prediction serve different purposes. Describing what a player did is not the same as estimating what will happen next. Converting an illustrative decimal price to an implied percentage is also a different operation from measuring an independent chance of success. The calculation may be correct while the conclusion attached to it is unsupported. Ask where the probability came from, which assumptions it needs and whether those assumptions were checked against the situation being discussed.
For another educational resource, Cricketin's cricket guides cover rules and explanatory mathematics. This is a sponsored partner reference. It does not turn this workshop into a betting operator, an account service or a source of guaranteed results. You can learn from all the cricket examples here without staking money. The useful outcome is an argument you can explain and revise, rather than a promise that a particular number will make uncertainty disappear from sport.
Make a correction that reaches the conclusion
When an input changes, revisit the interpretation as well as the chart. A corrected ball count may alter a rate, which may alter a ranking, which may weaken the sentence built around that ranking. Updating only the displayed number leaves the rest of the argument attached to an obsolete result. Keep a short record of the original question, source, calculation and conclusion so that the dependency is easy to follow. This is a practical habit for a small personal notebook as much as for a published article.
Do not rewrite every earlier uncertainty as if the correct result had always been obvious. An analysis can improve when new evidence arrives. Explain which observation changed and why that affects the assessment. If the correction does not affect a broader conclusion, say why it survives. The aim is to make the reasoning visible enough for a reader to disagree with it precisely. A correction process that can be understood is more useful than an impressive display of certainty that cannot be audited.
Leave the workshop with a usable method
Before sharing a cricket comparison, check five things: the question, the sample, the units, the calculation and the limit on the claim. Read the label without the player's name and ask whether it still describes the evidence accurately. If a chart needs a lengthy explanation of omitted matches or changing definitions, put the explanation next to it. If the necessary information is missing, mark the gap rather than supplying a plausible-looking number. An empty field is sometimes a more accurate result than zero.
Return to the Performance Factory workshop whenever you want to test that process on a new example. The comparison manual helps establish fair terms; the sample manual helps test how much those terms can support. The two work together. Better cricket analysis does not require every reader to become a statistician. It requires a question worth answering, evidence that actually belongs to it and enough clarity that another person can follow the route from one to the other.